
Analyzing Java Garbage Collection Logs for debugging and optimizing Apache Spark jobs
Recently while trying to make peace between Apache Parquet, Apache Spark and Amazon S3, to write data from Spark jobs, we were running into recurring issues. In this post I would describe identifying and analyzing a Java OutOfMemory issue that we faced while writing Parquet files from Spark.
What we have
A fairly simple Spark job processing a few months of data and saving to S3 in Parquet format from Spark, intended to be used further for several purposes. To improve access, we got the data partitioned based on the date of generation. So far so good and in development our systems ran just fine to move forward. However the moment we started loading actual data, of approx 150 GB as a test, our jobs became slower and slower to a point when it started throwing Out of Memory Exception in Spark.
What the error looked like
One of the interesting errors was a java OutOfMemoryError with GC Overhead limit exceeded.
17/05/12 10:48:36 WARN NioEventLoop: Unexpected exception in the selector loop.
java.lang.OutOfMemoryError: GC overhead limit exceeded
...
...
17/05/12 10:48:52 ERROR InsertIntoHadoopFsRelation: Aborting job.
java.lang.OutOfMemoryError: Java heap space: failed reallocation of scalar replaced objects
17/05/12 10:48:52 ERROR ErrorMonitor: Uncaught fatal error from thread [sparkDriver-akka.remote.default-remote-dispatcher-5] shutting down ActorSystem [sparkDriver]
java.lang.OutOfMemoryError: GC overhead limit exceeded
Reproducing the error
To reproduce the error I wrote a small piece of code after doing the full analysis to understand what is wrong. It is available as a gist here. I wrote just as much as it is needed to create this issue primarily for writing this blog. Submit the code as follows after making suitable changes to reproduce the error. I had used Spark 1.5.2 with Scala 2.10.4
nohup spark-submit --packages com.github.scopt:scopt_2.10:3.3.0 \
--master yarn-client --executor-memory 6g --executor-cores 1 --num-executors 40 \
--driver-memory 2g \
--conf spark.storage.memoryFraction=0.4 \
--class org.anish.spark.gcissue.SparkParquetGcOutOfMemory --verbose JarFileName.jar \
--outputTableName feed.temporary \
--outputTablePath s3a://your-bucket-name/junkData/ \
--outputTableFormat parquet \
--outputTableSaveMode append \
--rows 1000000 \
--cols 500 \
--repeat 20 \
--parquetEnableSummaryMetadata true &
This creates a data frame with random integers having 500 columns and 1000000 rows. And the repeat specifies how many times it should append to the final location where it is trying to write this data.
Debugging
A bit of background on the complexity of the logic in the Spark Job and data size:
The job we were having was fairly simple with a couple of transformations and filters processing around 100GB data. There were no joins or aggregations going on. In short all the transformations can be expressed as a single stage map operation and there was absolutely no need for any data to be cached in memory. We can very well stream the input and write to output, after adding partition information. So a OutOfMemory Exception is fairly unexpected. We also do not have any collect/take/show/etc in our job. The computation is triggered by the df.write.save api on the data frame, so the data should not be coming to the driver anytime.
A quick Google search with the error and some skimming through JVM docs says that “the garbage collector is taking an excessive amount of time (by default 98% of all CPU time of the process) and recovers very little memory in each run (by default 2% of the heap).” But we are yet to understand which JVM is throwing this error. There are multiple executors running and our dearest driver.
To debug, the fist option was to play around with the executor memory (because the data is being processed there), which proved futile after a few attempts. Checking a few executor logs managed by YARN also doesn’t reveal any error. This seems to be a dead end.
Enabling GC logging at the executors
The next approach is to understand what is there in the JVM heap that triggers this error. To understand this further we turn on GC logging so that we get to know what is going on in the JVM. Spark provides us with the configuration spark.executor.extraJavaOptions with which we can pass options to the JVM.
To start this we add the following to the spark-submit
--conf spark.executor.extraJavaOptions='-XX:+PrintFlagsFinal -XX:+PrintReferenceGC -verbose:gc -XX:+PrintGCDetails -XX:+PrintGCTimeStamps -XX:+PrintAdaptiveSizePolicy -XX:+UnlockDiagnosticVMOptions -XX:+G1SummarizeConcMark'
The above would print the GC logs to the executors stdout. These logs would be really big in size. We had around 100MB logs, with INFO log level for Spark. Now take out a few executor logs and compress them bring those out of the cluster to analyze further.
$ yarn logs -appOwner <your-user-name> -applicationId <yarn-application-id> -containerId <container-id> --nodeAddress <executor.node:port> -logFiles stdout >executor1stdout.txt
Here the container id, and node address can be seen from the Spark UI executors tab. This would give us the file which after compressing would be small enough to analyze further.
Here I used a free GC log analyzer: GC Easy
A few stats from the job is interesting and here as follows:
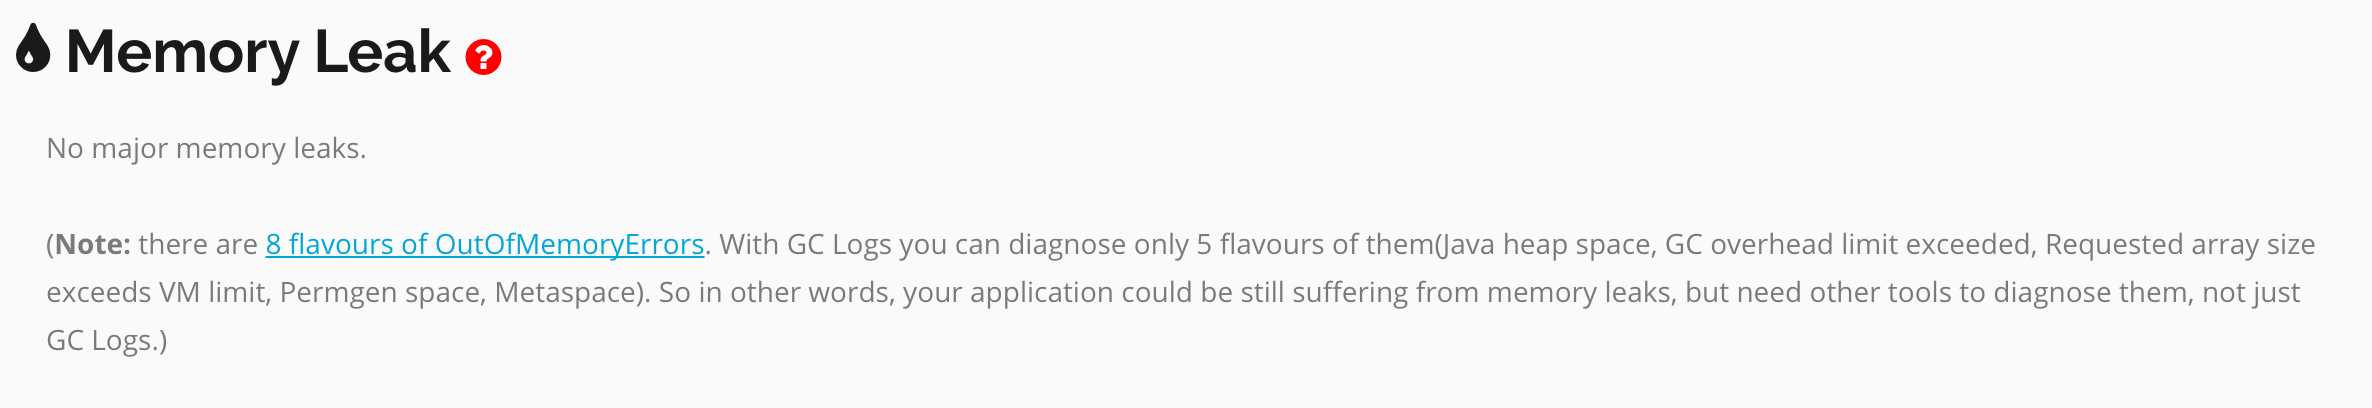 The analysis shows that there is no Memory Leak going on.
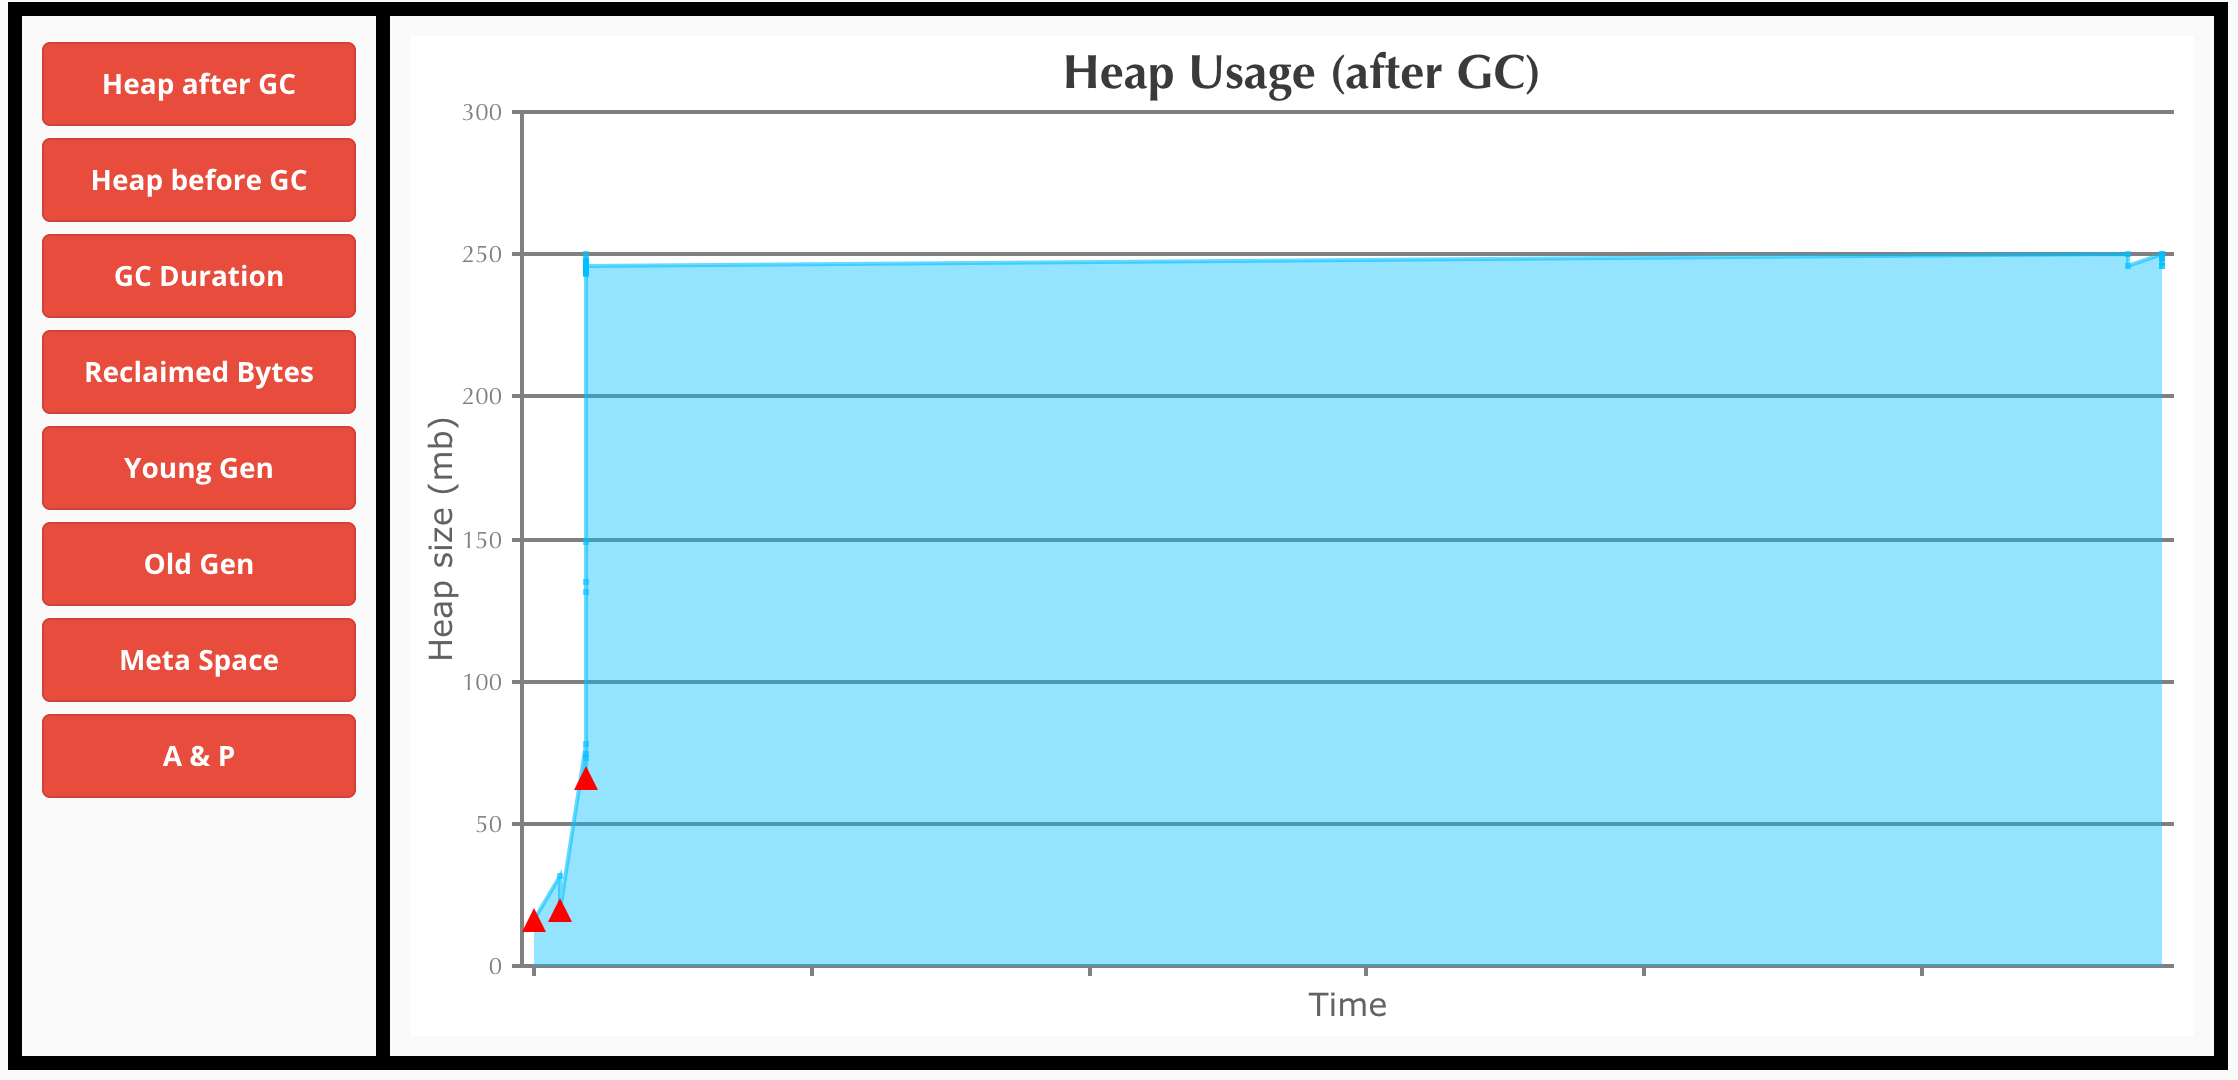 The Heap Usage after GC looks like a constant value, doesn’t look like there is any problem.
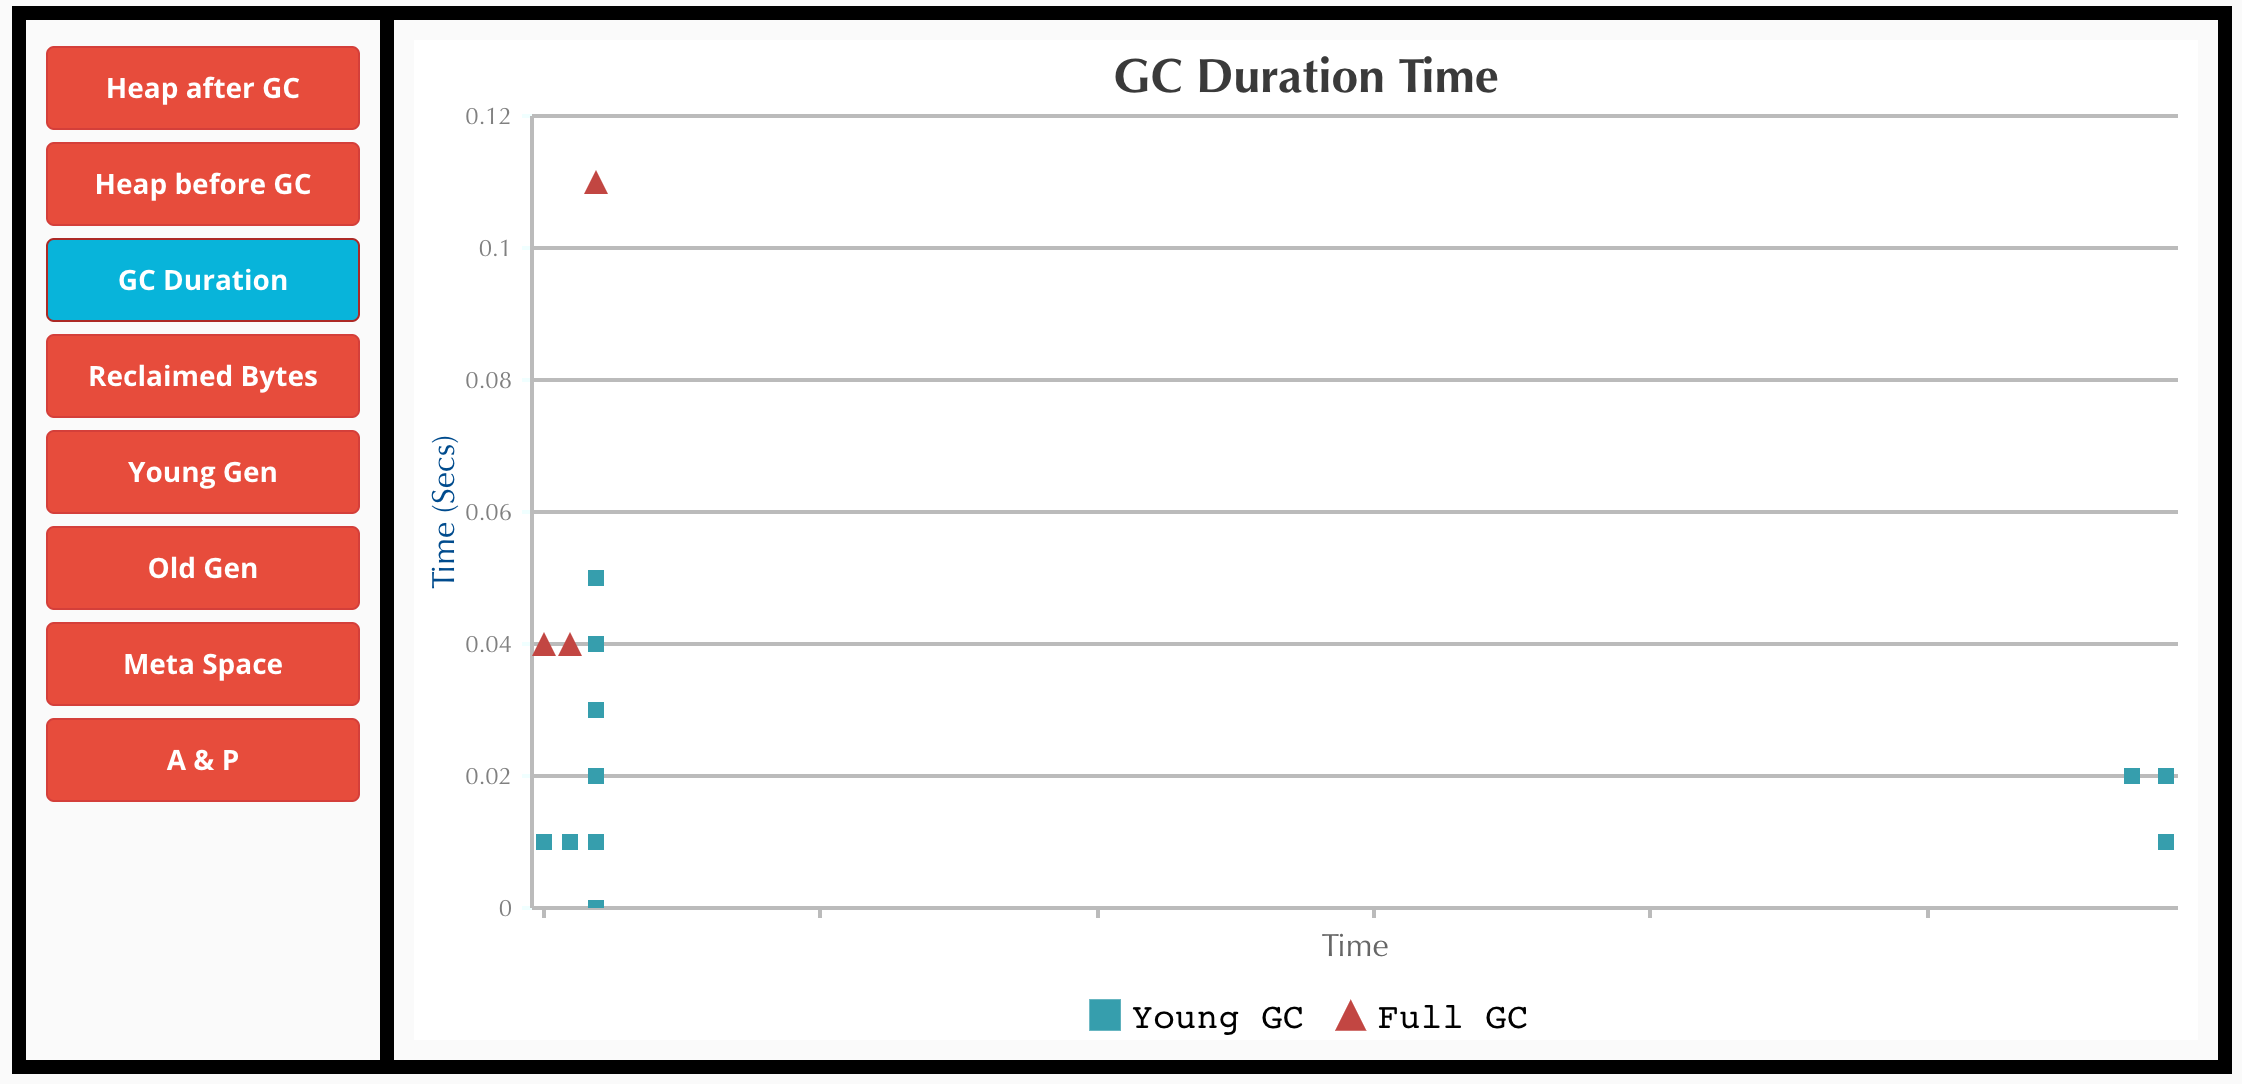 The amount of time spent by the Garbage Collector.
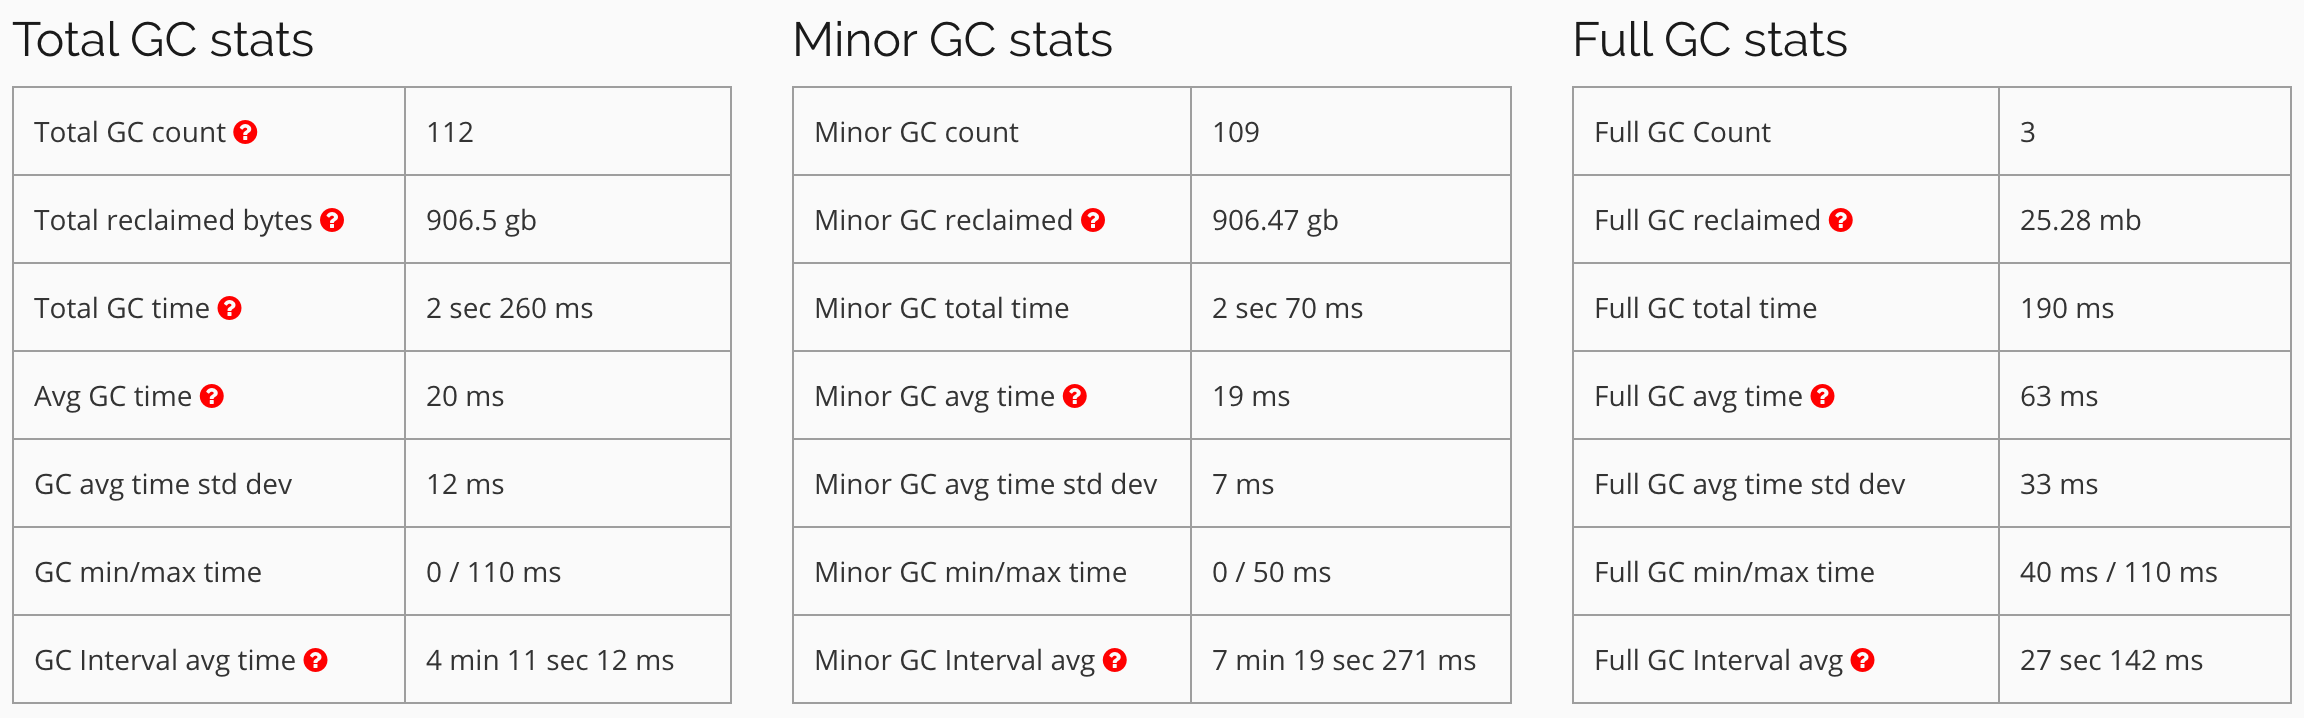 Stats calculated from the GC logs
From the above graphs, its clear that things are running smoothly at the executors. GC isn’t taking a long time and is in milliseconds. Most of the garbage is collected by Young GC, and Full GC doesn’t do a lot of work. (You might be interested in reading and understanding a bit about Java GC before interpreting these graphs. This Spark related post from Databricks has some excellent explanations)
Enabling GC logging at the driver
Now the above action was a waste of time. In fact if I had analyzed the Spark log a bit carefully I would have identified the issue faster. It tells us two things (in the last 3 lines of the log at the beginning of the post):
- A class that was able to see this error and act: It is
ERROR InsertIntoHadoopFsRelation: Aborting job.So this means that the job was aborted due to an error somewhere by the InsertIntoHadoopFsRelation class. This implies that the data was fine and was processed without exceptions being thrown, but it wasn’t able to insert into a HadoopFsRelation. - The thread which threw this uncaught exception: This thread is named
[sparkDriver-akka.remote.default-remote-dispatcher-5]and after the error the sparkDriver ActorSystem was shut down. A brief idea about how Spark is implemented and how Akka Actors communicate with each other helps us infer that this error is thrown in the sparkDriver Actor System which is in our driver JVM.
I did try a random shortcut to increase the driver memory from the default 1g using --driver-memory 2g in my spark-submit, just to see if it resolves the issue or there is really something nasty going underneath, but this doesn’t help.
However after this, I don’t want to try with 32g driver because I know I am not collecting any data to the driver and something is wrong here.
Thus as the next step we enable GC logging in the driver.
--conf spark.driver.extraJavaOptions='-XX:+PrintFlagsFinal -XX:+PrintReferenceGC -verbose:gc -XX:+PrintGCDetails -XX:+PrintGCTimeStamps -XX:+PrintAdaptiveSizePolicy -XX:+UnlockDiagnosticVMOptions -XX:+G1SummarizeConcMark'
These logs have been printed in the stdout (I was running with yarn-client as a master). Once again uploading these to GC Easy shows us the following results:
 The analysis shows that there is Memory Leak in the driver JVM.
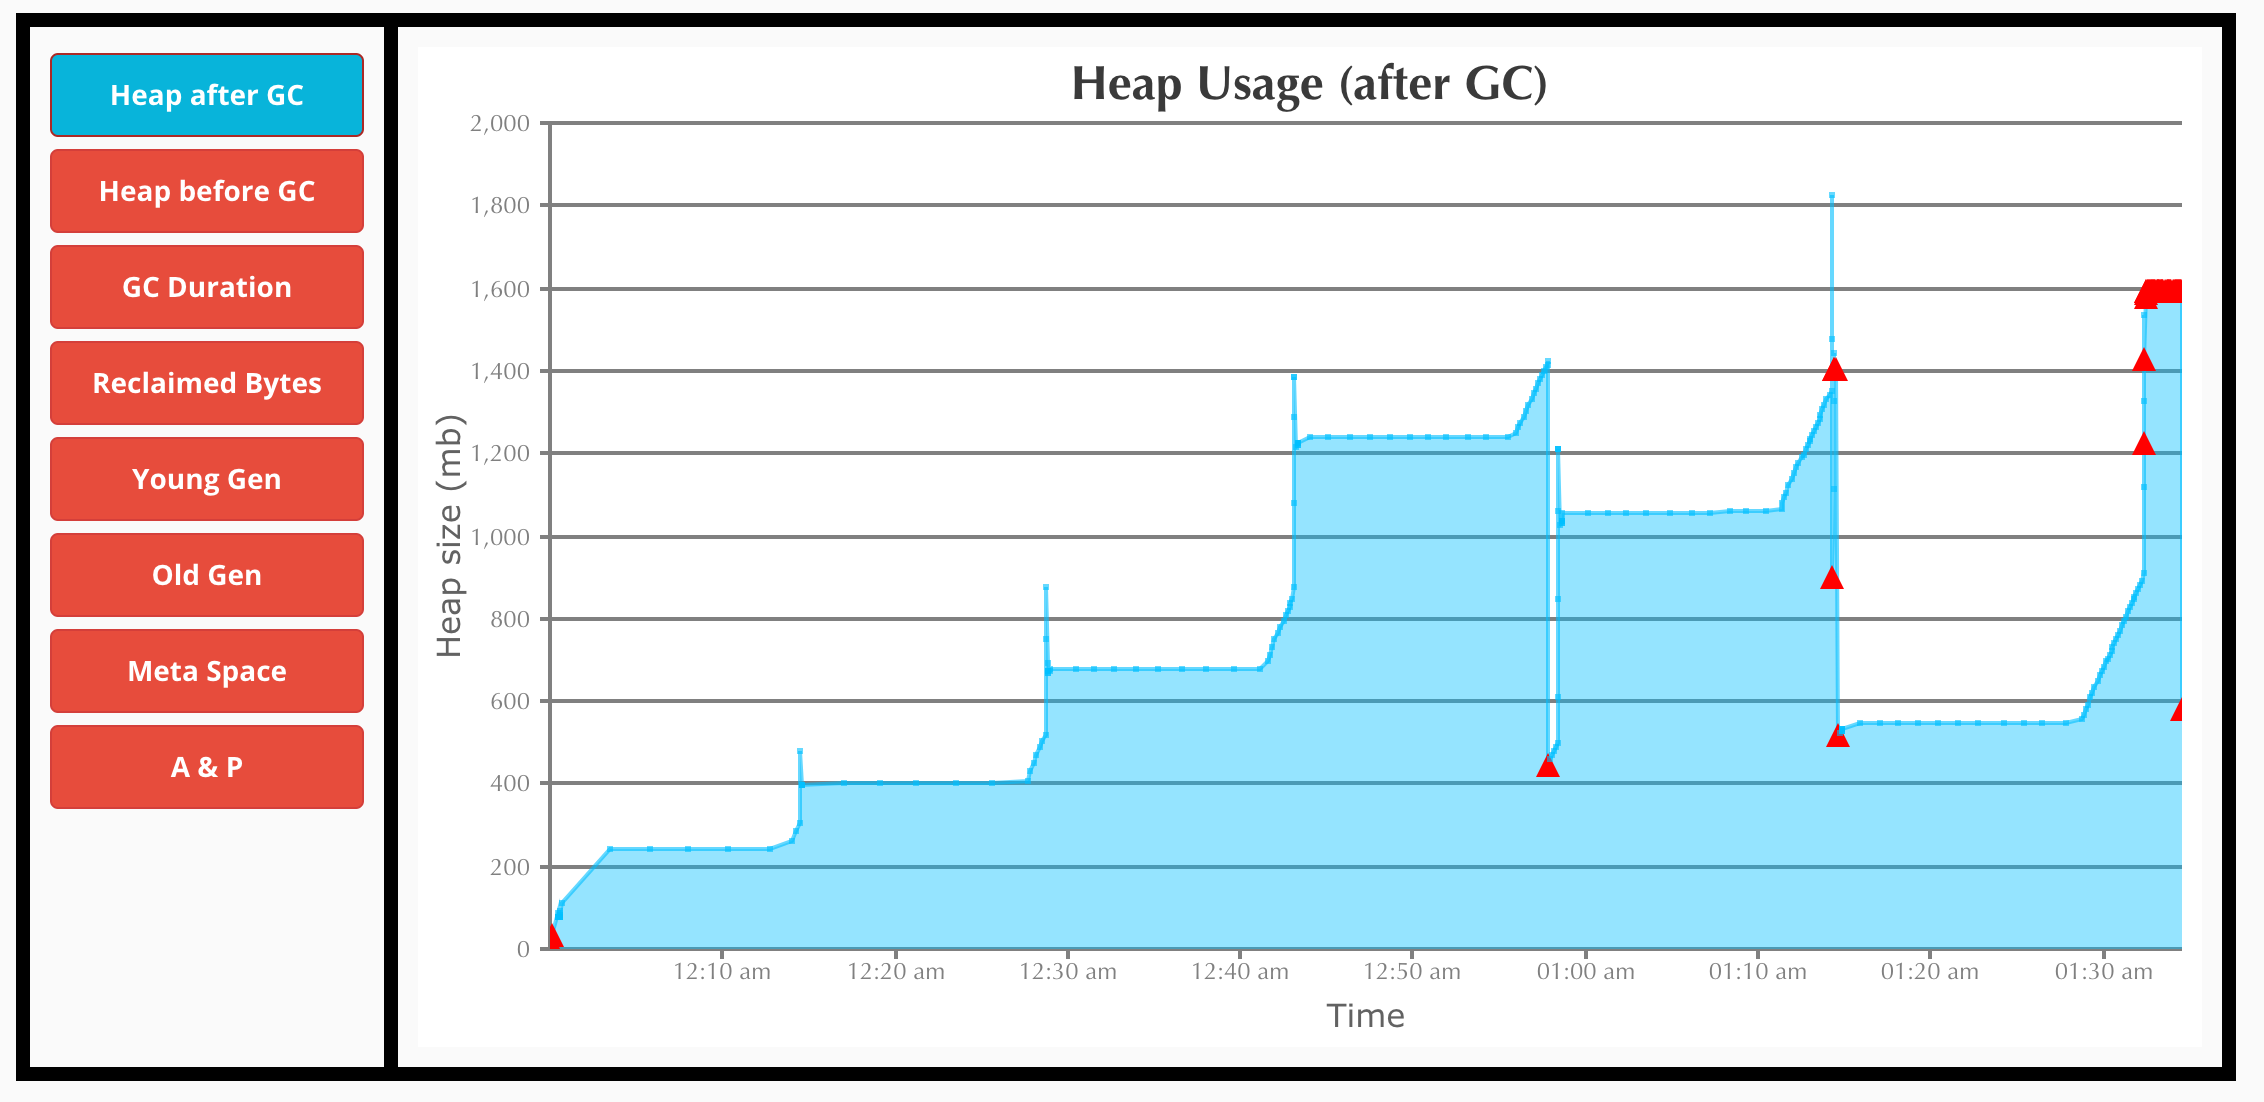 The Heap Usage after GC. Towards the end it remains constant.
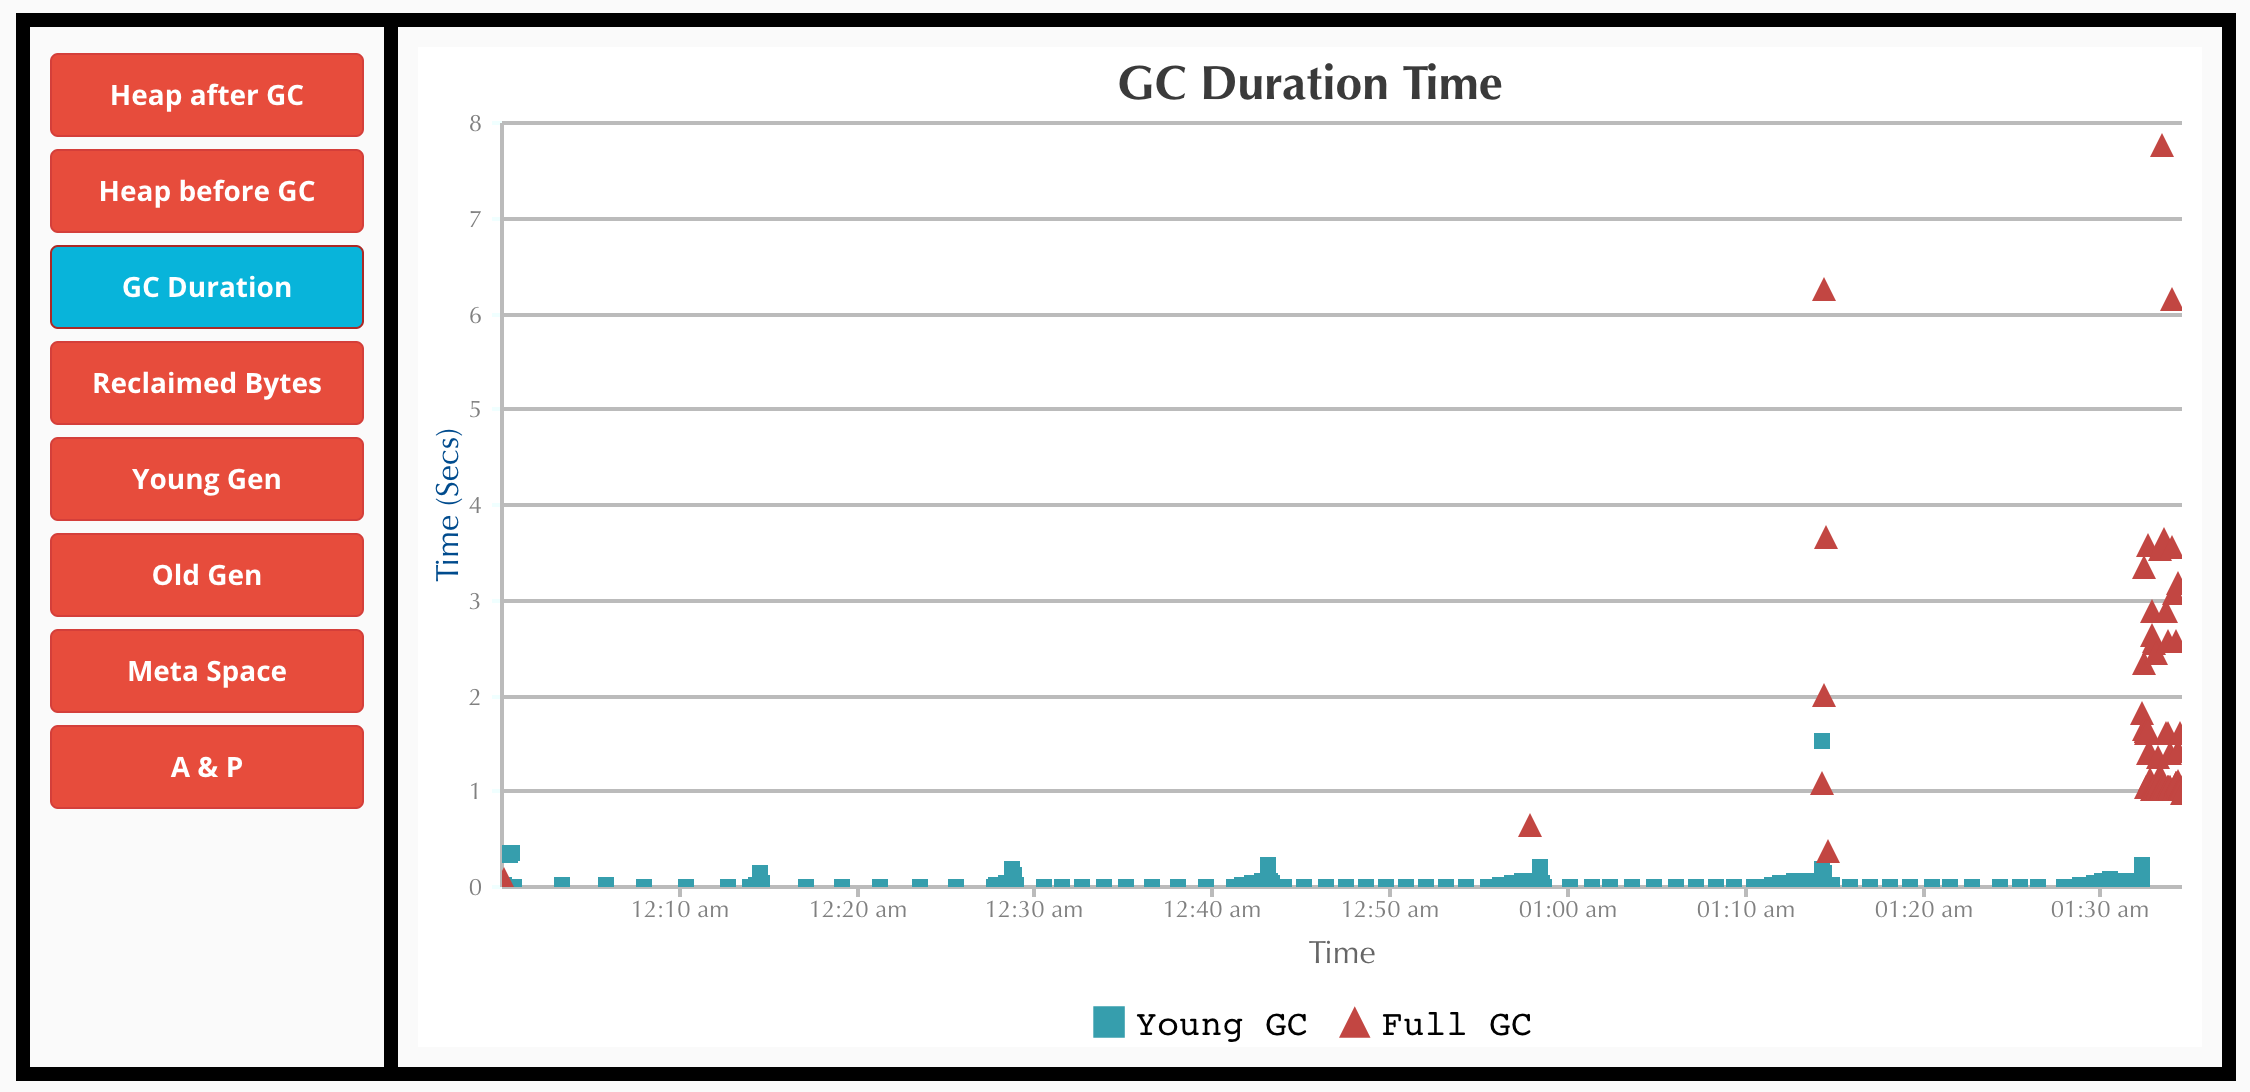 The amount of time spent by the Garbage Collector. It is very high towards the end.
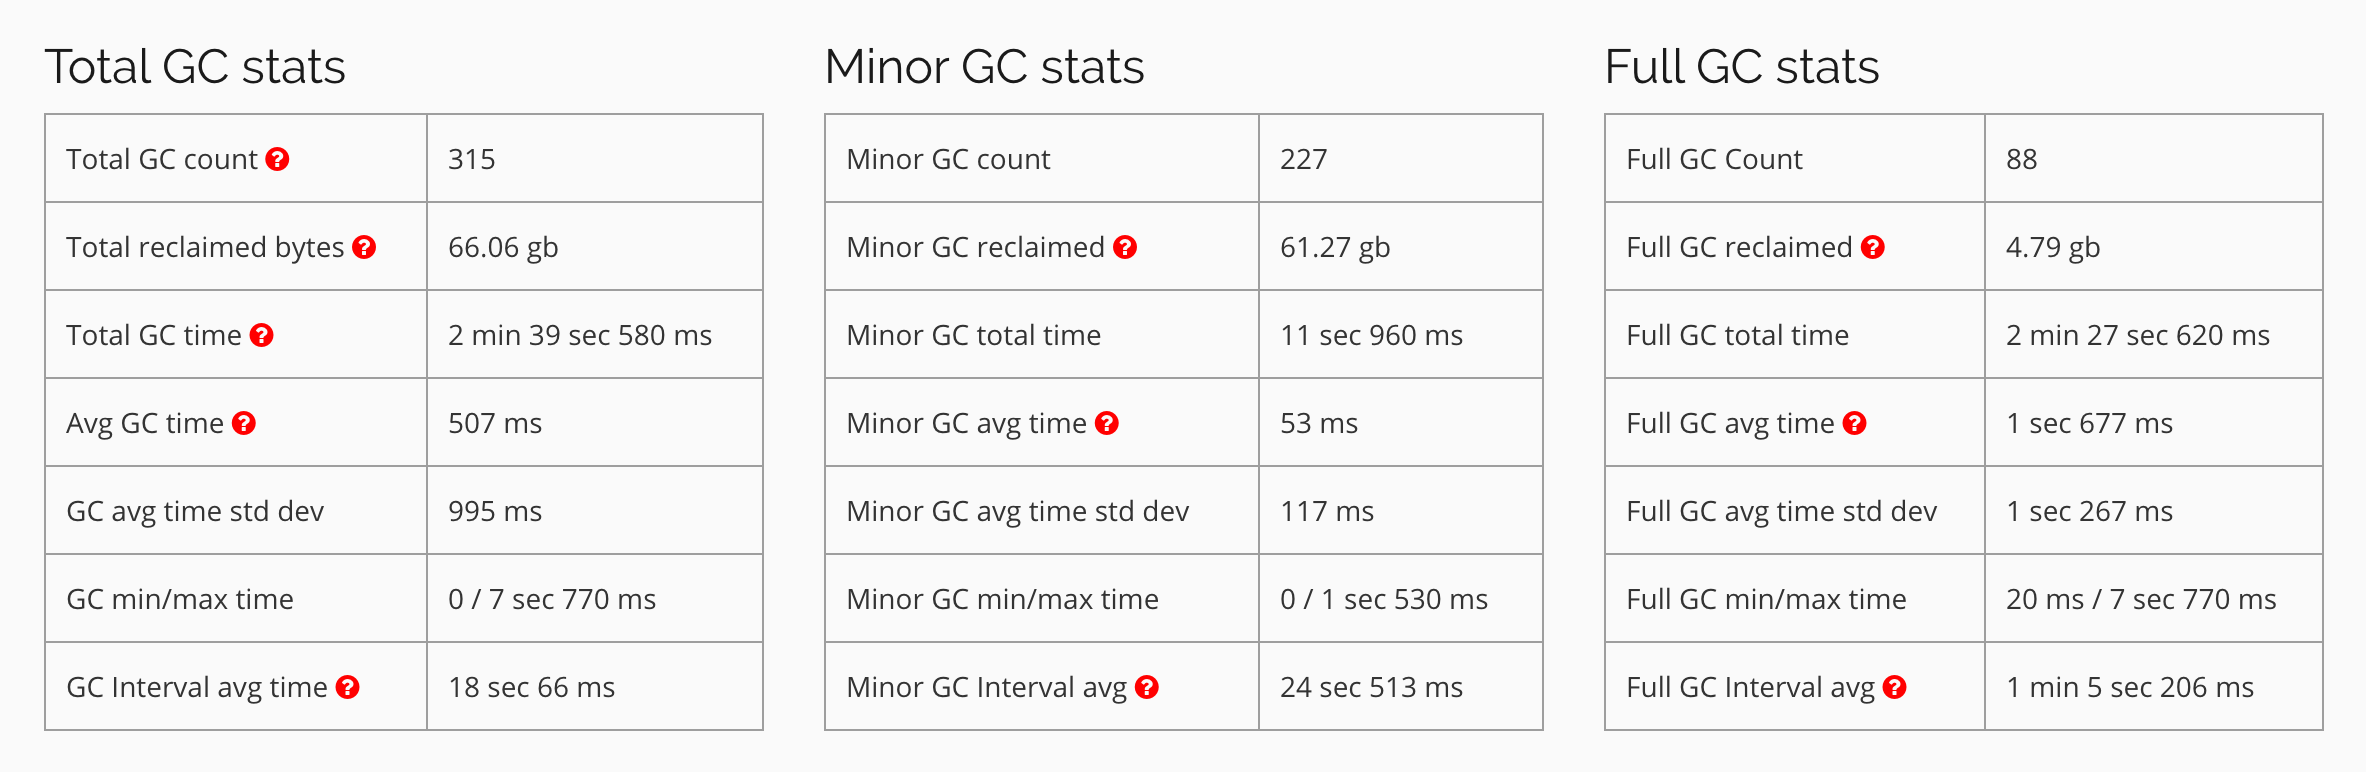 Stats calculated from the GC logs showing high amount of time taken for Full GC
Now we can understand the following things:
- It clearly tells us that there is a Memory Leak.
- Towards the end of processing, we can see that there are multiple Full GC runs with no change in Heap Size. (This looks apt with the description in JVM docs about the Exception being thrown)
- The max time of Full GC is 7 sec.
- The number of Full GC is quite high towards the end before it throws the error and shuts down.
We are sure that the driver is the culprit here. Now the next question would be about the objects that are being created in the driver JVM which needs so much memory. So my next step is to analyze the JVM Heap Memory using Heap Dumps.
Analyzing the JVM Heap Dump
Along with all the other driver JVM options we add -XX:+HeapDumpOnOutOfMemoryError.
This would create a Heap Dump in the working directory. Since we are running in yarn-client, the driver home directory is same as the one from which we are submitting the job. The final Spark driver JVM options looks as follows:
--conf spark.driver.extraJavaOptions='-XX:+PrintFlagsFinal -XX:+PrintReferenceGC -verbose:gc -XX:+PrintGCDetails -XX:+PrintGCTimeStamps -XX:+PrintAdaptiveSizePolicy -XX:+UnlockDiagnosticVMOptions -XX:+G1SummarizeConcMark -XX:+HeapDumpOnOutOfMemoryError'
Now since we were running with 2g driver memory, we have a nice 2.4gb heap dump created.
To analyze what is there in the Java Heap, I used a tool called Memory Analyzer which is an Eclipse plugin.
Now we need to run Eclipse on a JVM which is having more than 2g memory to analyze a 2g heap dump. Here I had change the JVM options of Eclipse so that it can analyze this dump.
I changed the VM option to -Xmx4096m in Contents/Eclipse/eclipse.ini inside the application package of the Eclipse app for Mac OS X.
Now after loading the heap dump and a bit of clicking around leads us to some interesting things.
- 1.5g of total 2g is used by Thread main
- This also tells us leak suspects. Going there we try to see the Thread Stack to understand which function goes on allocating memory. This stack is the key to finding the root cause. More on this later
- The dominator tree tells us which are these objects. We see
org.apache.parquet.format.RowGroupwhich also storesorg.apache.parquet.format.ColumnChunkwhich is internally havingorg.apache.parquet.format.ColumnMetaDataand thenorg.apache.parquet.format.Statistics
These information about the object names along with the call stack points us to the root cause described below.
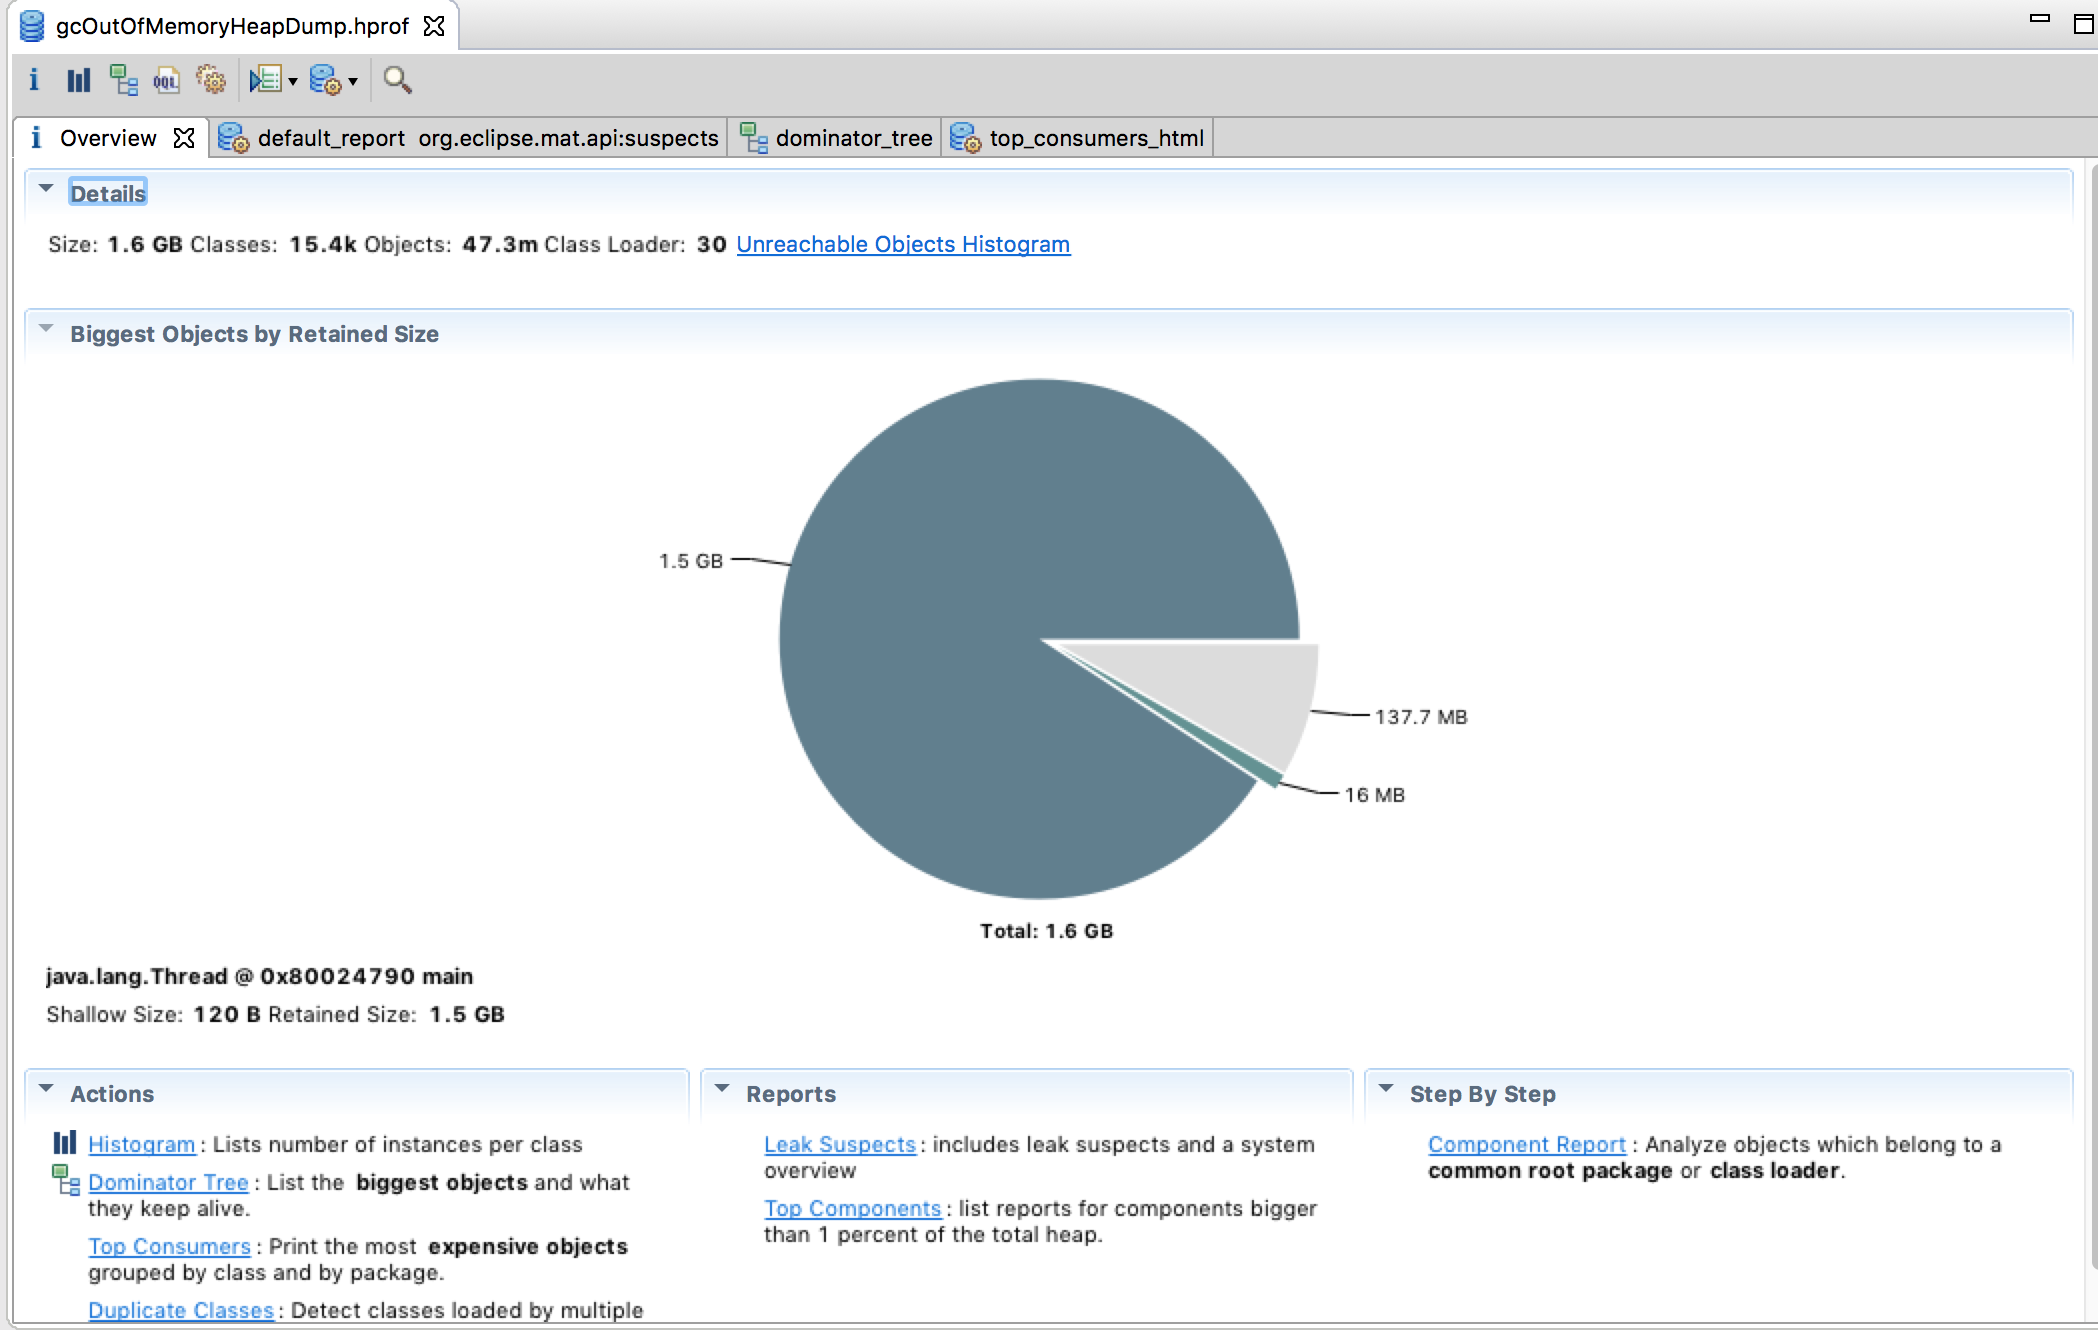 The overview of the Heap. We see that one thread has 1.5g of the total 2g of memory.
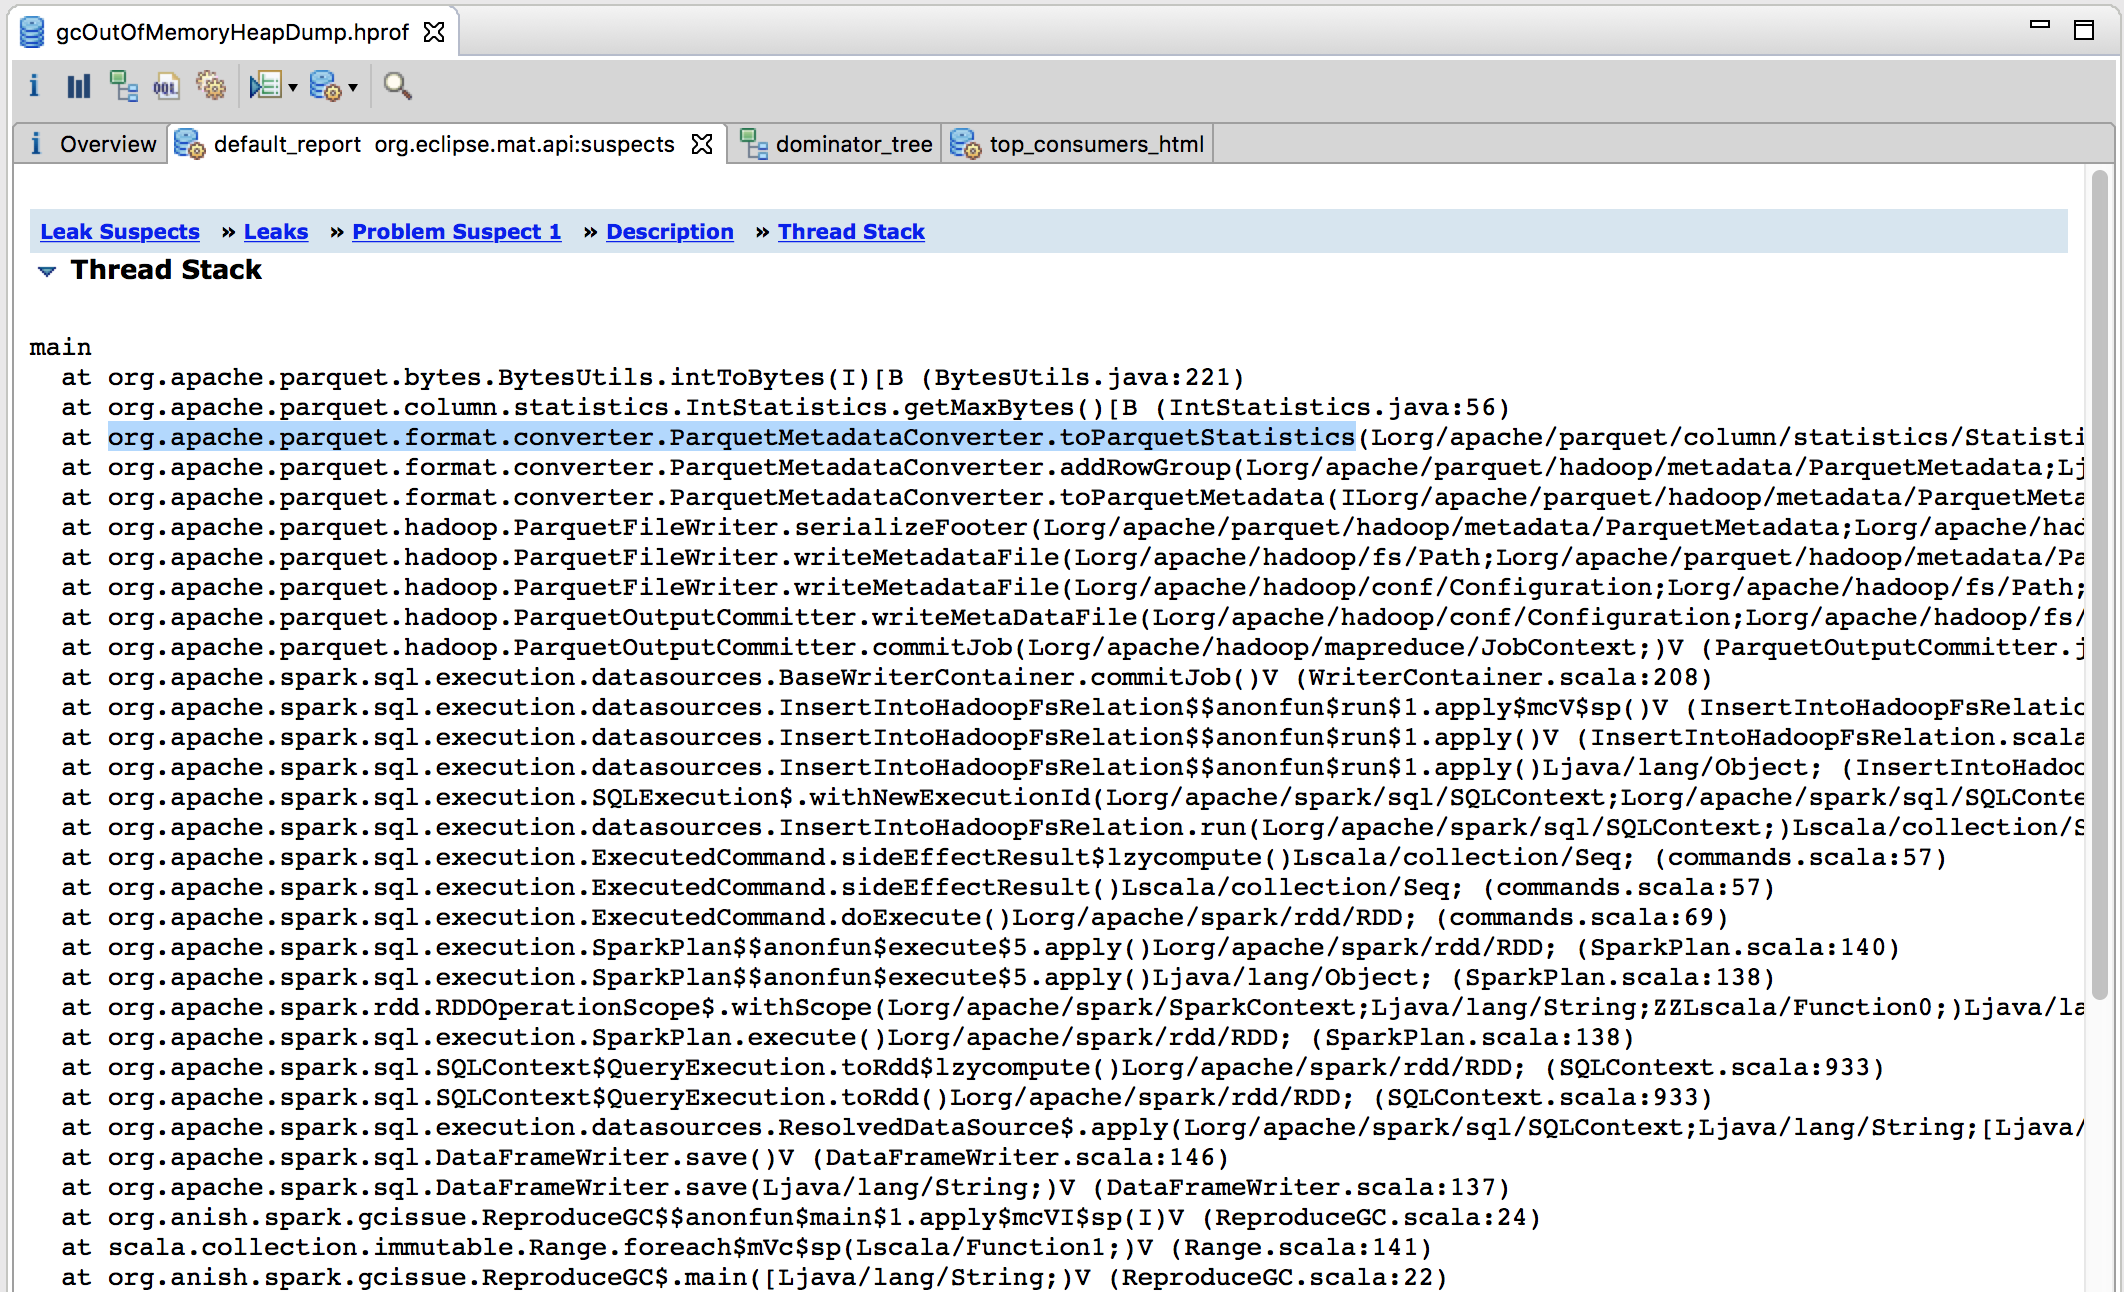 The call stack of the thread which is taking up most of the memory.
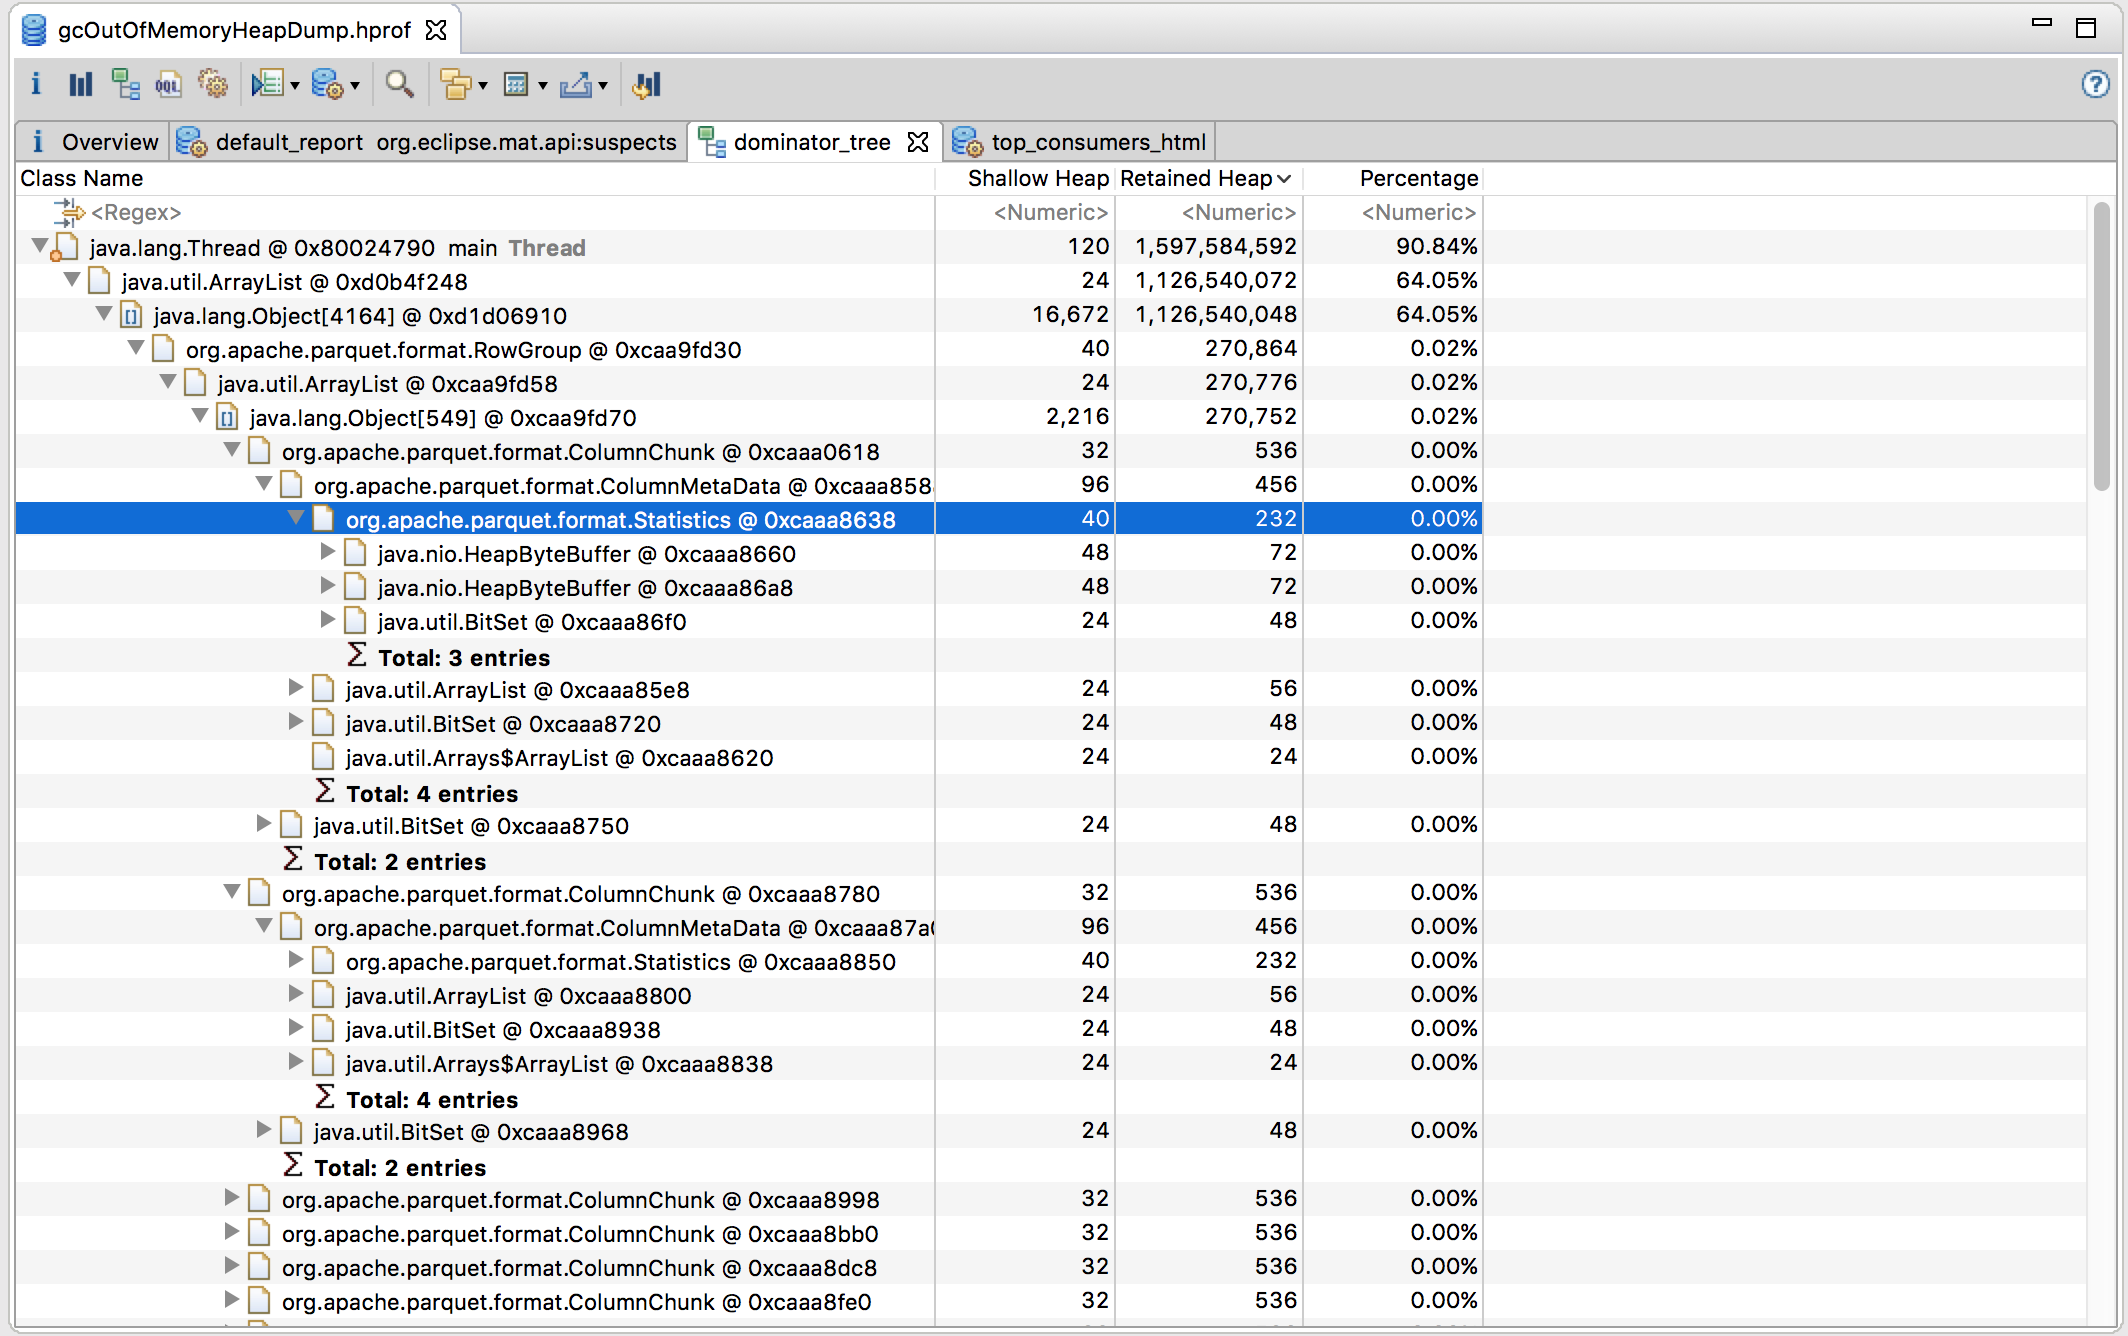 The dominator tree showing us the objects which are consuming the most space in memory.
The problematic call stack
main
  at org.apache.parquet.bytes.BytesUtils.intToBytes(I)[B (BytesUtils.java:221)
  at org.apache.parquet.column.statistics.IntStatistics.getMaxBytes()[B (IntStatistics.java:56)
  at org.apache.parquet.format.converter.ParquetMetadataConverter.toParquetStatistics(Lorg/apache/parquet/column/statistics/Statistics;)Lorg/apache/parquet/format/Statistics; (ParquetMetadataConverter.java:242)
  at org.apache.parquet.format.converter.ParquetMetadataConverter.addRowGroup(Lorg/apache/parquet/hadoop/metadata/ParquetMetadata;Ljava/util/List;Lorg/apache/parquet/hadoop/metadata/BlockMetaData;)V (ParquetMetadataConverter.java:167)
  at org.apache.parquet.format.converter.ParquetMetadataConverter.toParquetMetadata(ILorg/apache/parquet/hadoop/metadata/ParquetMetadata;)Lorg/apache/parquet/format/FileMetaData; (ParquetMetadataConverter.java:79)
  at org.apache.parquet.hadoop.ParquetFileWriter.serializeFooter(Lorg/apache/parquet/hadoop/metadata/ParquetMetadata;Lorg/apache/hadoop/fs/FSDataOutputStream;)V (ParquetFileWriter.java:405)
  at org.apache.parquet.hadoop.ParquetFileWriter.writeMetadataFile(Lorg/apache/hadoop/fs/Path;Lorg/apache/parquet/hadoop/metadata/ParquetMetadata;Lorg/apache/hadoop/fs/FileSystem;Ljava/lang/String;)V (ParquetFileWriter.java:433)
In the third line of the above stack it is clear that Parquet is trying to calculate Column Statistics and the problem comes up when writing the MetadataFile (last line above). Also from the objects in the dominator tree, it seems that it is trying to compute column stats for each file.
A quick Google Search about Parquet and how it works helps in understanding that it creates the _common_metadata file which stores metadata information from each of the file footers. And this whole merging of metadata from each of the files’ footers to the common metadata file is happening in the driver and on the main thread itself.
Thus it is trying to download the whole metadata and trying to combine that.
Problem analysis and Solution
Does Spark really need the common metadata? Apparently while reading, it tries to create it and initializing reads from Parquet files is also slow. Is this really necessary? No. Things would work just fine (Read here). It would read the metadata while reading the files anyway. The common metadata file helps when there are multiple schemas and there are multiple nested sub directories. With our use case we were not having that at the current moment.
Thus a probable candidate for fixing this issue is to disable this metadata generation. To do this we add the following to our code, and this has to be with the hadoopConfiguration:
sparkContext.hadoopConfiguration.set("parquet.enable.summary-metadata", "false")
While reading the data we also disable merging of metadata by using the following in spark-submit
--conf spark.sql.parquet.mergeSchema=false
Now we run the code again. And yes, things work fine.
If we really need to generate the MetaData, we can use the following code:
Other optimization
One more optimization to take note of is to use DirectParquetOutputCommitter which commits directly without creating a _temporary folder which speeds up processing considerably when working with Blob stores like S3. But more on this on a different post.
sparkContext.hadoopConfiguration.set("spark.sql.parquet.output.committer.class", "org.apache.spark.sql.parquet.DirectParquetOutputCommitter")
Notes:
- Spark version used for this is 1.5.2
- JVM version is 1.8.0_77 and is a Java HotSpot 64-Bit Server VM.
- Scala compiler version is 2.10.4
- The JVM options and tools for Heap Dump analysis may vary from different JVM distributions.
References
- https://plumbr.eu/outofmemoryerror/gc-overhead-limit-exceeded
- http://stackoverflow.com/questions/542979/using-heapdumponoutofmemoryerror-parameter-for-heap-dump-for-jboss
- https://dzone.com/articles/java-heap-dump-are-you-task
- https://crunchify.com/increase-eclipse-memory-size-to-avoid-oom-on-startup/
- http://javaeesupportpatterns.blogspot.in/2011/11/hprof-memory-leak-analysis-tutorial.html
- https://forums.databricks.com/questions/6494/do-you-need-a-metadata-file-in-a-parquet-folder-to.html
- http://stackoverflow.com/questions/37327626/generate-metadata-for-parquet-files
- http://stackoverflow.com/questions/34935393/append-new-data-to-partitioned-parquet-files
- https://www.appsflyer.com/blog/the-bleeding-edge-spark-parquet-and-s3/
Leave a Comment